Vendors in this space love a case study: a named brand, a 340% lift, a tidy narrative. We are not going to invent one. What is genuinely useful is the method, because you can run it this week on data you already have, and the answer will be about your catalogue rather than someone else's.
Step 1 — Find your true per-image cost
Take twelve months of photography spend. All of it: shoot fees, studio hire, model fees and usage rights, crew, sample shipping, retouching invoices, reshoots, and the internal hours your team spent coordinating. That last one is real money and it is always left out.
Divide by the number of images you actually published — not shot. Selects that never made it to the site cost you money and returned nothing.
Most brands running this for the first time find their real per-image cost is two to four times the number they had been quoting internally.
Step 2 — Map your coverage
Export your catalogue with an image count per product. Then segment it. You are looking for the products sitting at one image, and specifically the ones at one image that still generate meaningful revenue — those are underserved bestsellers, and they are the highest-return thing you can fix.
- How many products have fewer than three images?
- How many have no on-model image at all?
- How many colourways share a single photograph of one colour?
- What share of revenue sits behind those under-photographed products?
Step 3 — Measure the gap, don't assume it
Compare conversion rate between products with a full image set and products with one image, controlling as best you can for price and category. This is not a clean experiment — bestsellers tend to get more images precisely because they sell — but the direction and rough size are informative, and you can tighten it by looking within a single category.
Then look at return rate on the same split. Both numbers matter, and a strategy that improves one while worsening the other is not a win.



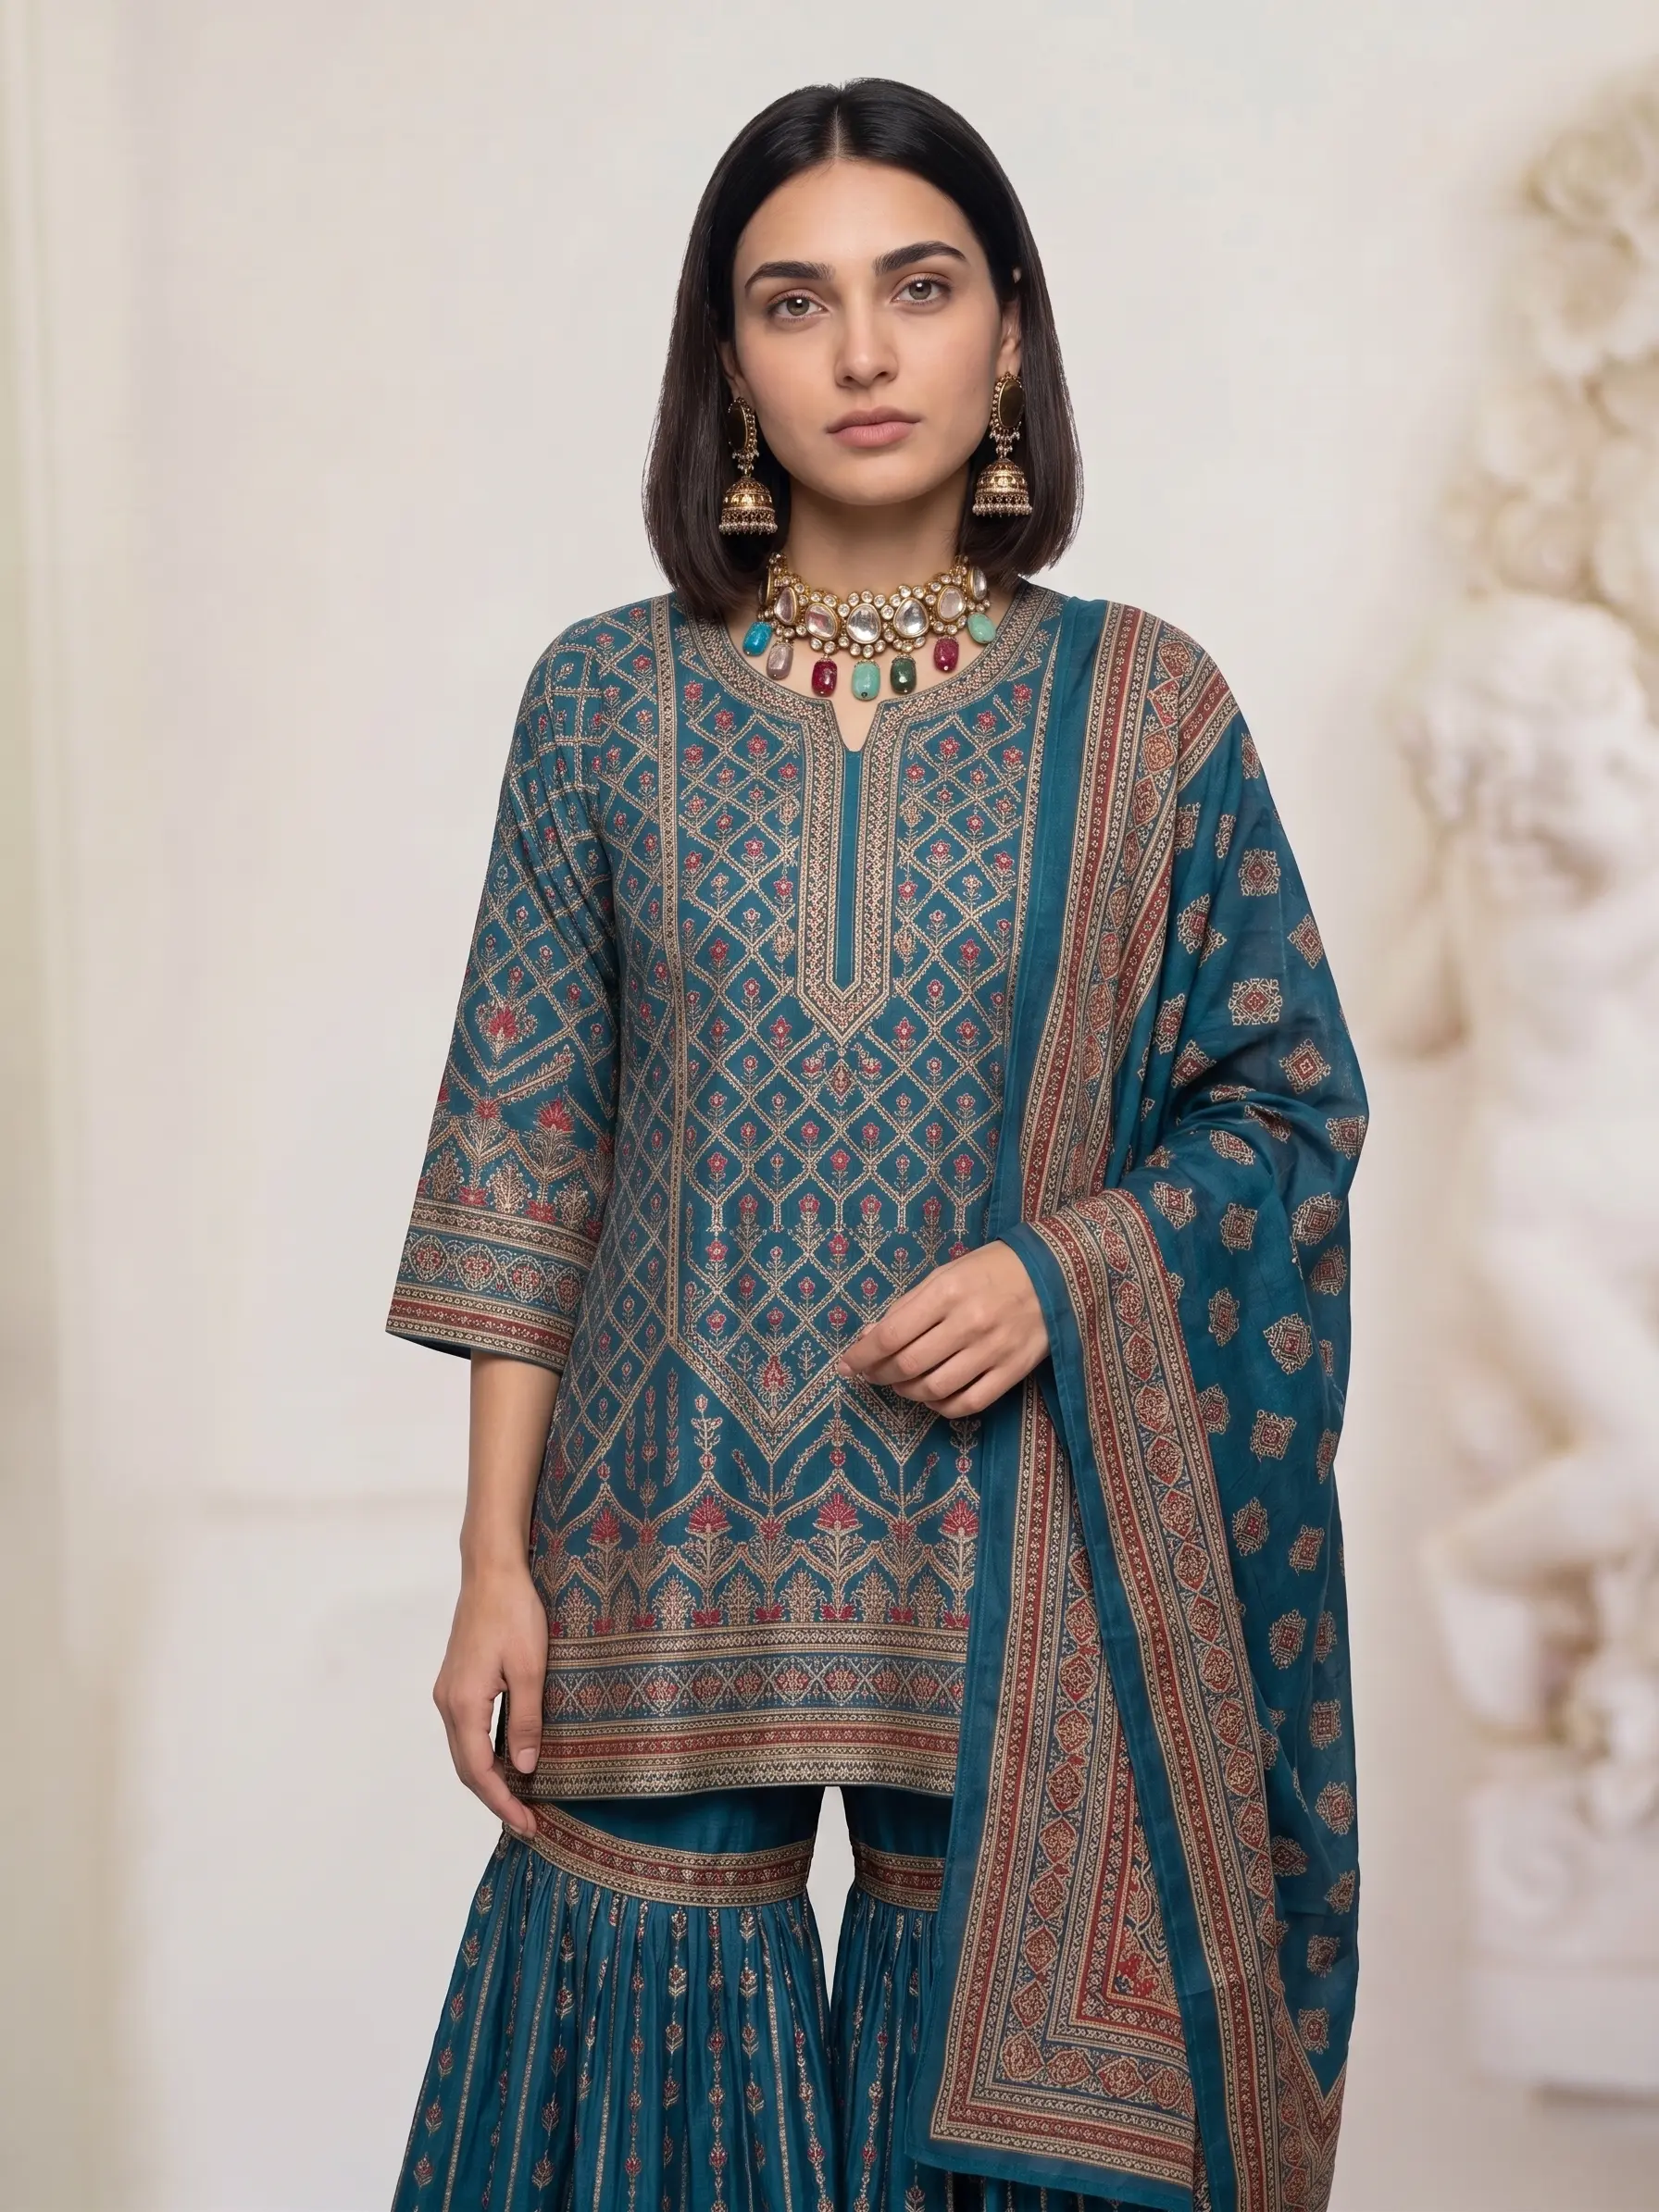


Products carrying a set like this convert differently from products carrying one flat photo. Segment your own catalogue by image count and check the conversion and return rates on each side before assuming the direction.
Step 4 — Value the speed, not just the cost
Measure the lag between stock arriving and its listing going live with final imagery. Multiply the average daily revenue of a comparable product by those days, across a year's arrivals. For brands that drop frequently, this number is often larger than the entire photography budget, and it is invisible on any P&L.
Step 5 — Decide with the numbers in front of you
Now you have four figures: true per-image cost, coverage gap, the conversion difference between covered and uncovered products, and the cost of the delay. Any change to how you produce images can be evaluated against those. Our own pricing page has a calculator for the cost side; the coverage and speed sides are yours to measure, and they are usually the larger half of the answer.